Economy
Cost of Living 2026: 9 Everyday Prices and How They Moved
We tracked nine everyday purchases through 2026: how bread, rent, fuel and transport moved, why the official figure feels wrong, and what you can do next.
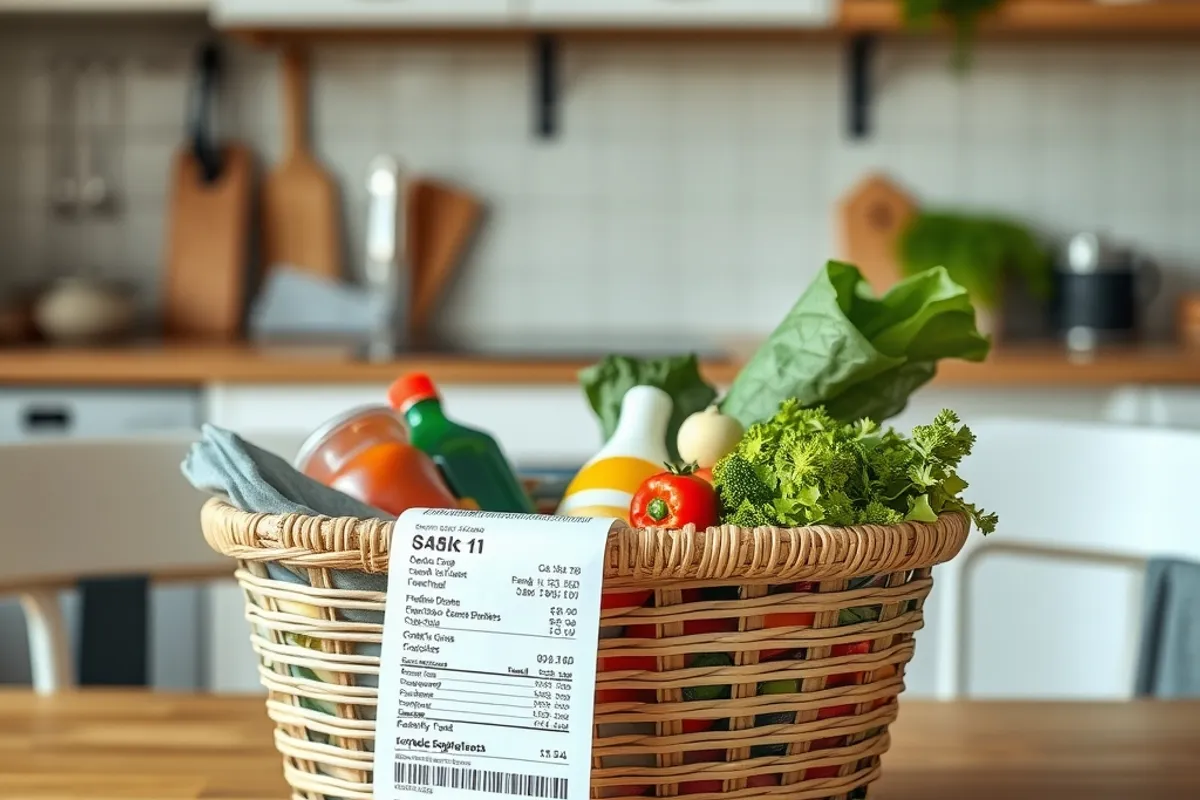
The cost of living is measured in averages and felt in specifics. A national index says prices rose by a few percent; a household notices that the rent renewal is up far more and the weekly shop no longer fills the same bag. Both can be true at once. This is what we found when we tracked nine everyday purchases through 2026.
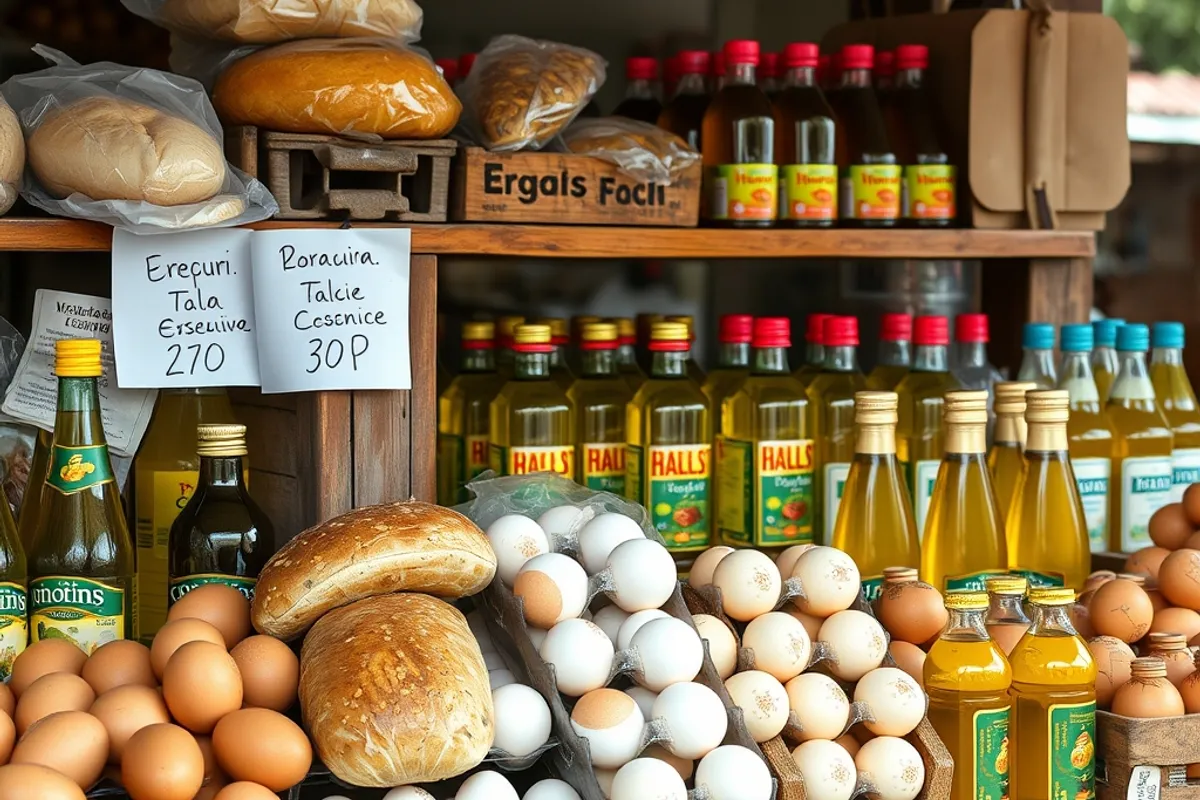
What we tracked and why
Our basket covers bread, milk, eggs, cooking oil, fuel, a bus fare, a basic phone plan, a mid-range takeaway meal and rent for a one-bedroom flat. We recorded prices in several cities each quarter, using the same product or service wherever possible.
We chose these items because they are hard to substitute in the short term. A household can delay a new coat; it cannot delay rent or a bus fare to work. That makes them a better guide to pressure than a basket dominated by discretionary spending.
Headline inflation describes an average shopper. Your bills describe you.
The nine prices, in plain terms
Food staples were volatile but ended the period close to where they started, with eggs and cooking oil swinging most. Fuel rose and fell with global prices. The bus fare and phone plan were the quiet climbers, both rising in small steps that are easy to miss because they are paid automatically.
Rent moved fastest and hurt most, because it is the largest fixed cost for most households. A mid-range takeaway meal rose roughly in line with wages, but portions shrank in several cities, which is a price rise the index does not capture. Our guide to the small business outlook explains why owners chose smaller portions over bigger menu prices.

Why the official figure can feel wrong
The official basket includes thousands of items and weights them by average household spending. If your household spends a larger share on rent and transport, your personal inflation will run higher than the national figure. If you own your home and work remotely, it may run lower.
Averages also hide distribution. A median rent is a better guide than a mean, because a handful of luxury lets can drag the average up. When you read a report, check which measure it uses and what period it covers. The difference can be larger than the headline number itself.

Where the money went
For a typical renter, housing absorbed the largest share of any increase, followed by transport and food. For an owner with a fixed mortgage, the picture was milder, though insurance and maintenance rose. Energy bills were volatile but less dominant than in the previous two years.
The practical consequence is that the same national inflation rate can mean very different things in two households on the same street. Policy that ignores that gap tends to help the wrong people. Our guide to local government transparency shows how to check what your council is doing about housing and transport costs.
What actually saved money
The biggest savings came from switching, not loyalty. Changing phone plan, insurer or energy tariff once a year beat every reward scheme we tested. Buying staples in larger packs worked when storage allowed. Cooking at home saved more than any discount app.
Timing mattered for big items. Booking transport and repairs outside peak weeks saved 10 to 20 percent. The least effective tactic was chasing small coupons; the effort rarely matched the saving. A written budget, reviewed monthly, did more than any single hack.
What to watch next
Watch rent renewals, transport fares and insurance premiums, because those are the costs that reset annually and quietly. Watch wage settlements too: a pay rise that lags the costs above is a cut in real terms, however good the headline number looks.
For a neutral explanation of how these figures are assembled, see the Wikipedia article on the cost of living. It explains the difference between indices and lived experience, which is the right frame before you read another inflation release. For the political side, see our guide to elections to watch.